Data Analysis + Solution
Data collected using Pandas, DataTime, Seaborn and scipy.stats
Correlation Coefficient for White students vs Poverty % of School: -0.77
Correlation Coefficient for Black students vs Poverty % of School: 0.39
Correlation Coefficient for Asian students vs Poverty % of School: -0.26
Correlation Coefficient for Hispanic students vs Poverty % of School: 0.49
Data Analysis:
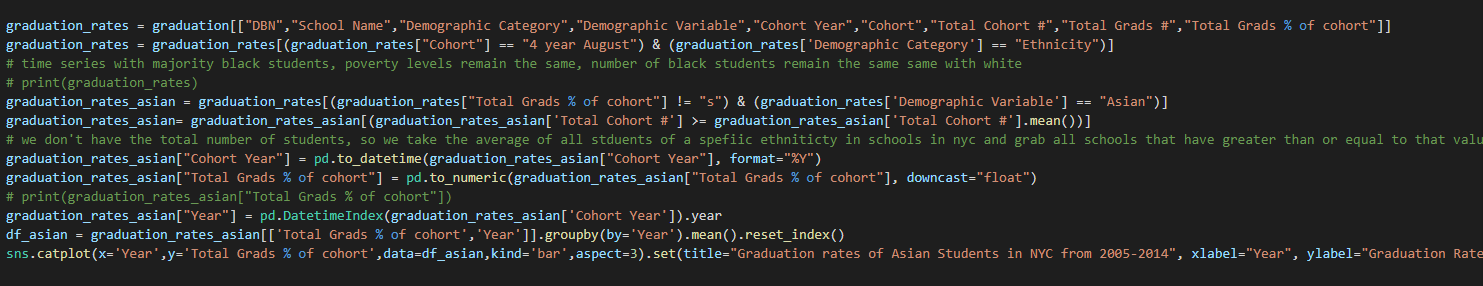
Before going on into the data analysis, all the code to gather the following data above can be found in " Resources + Code " section.
Majority of the collected data was forged by utilizing Pandas and filtering each dataframe to gather the needed columns, and using seaborn to plot them.
The first four lm plots show the distrbution of all schools divided into 4 different ethnicities plotted against poverty percentage of schools. As you can see, the best case sceanrio [No trend being seen] was not
presented. There is clear correlation between ethnicities and poverty percentages. There is already numerous evidence displaying the clear wealth gap between racial minorities and white indivduals, however the purpose of
this project was to show the disparity within schools, and as you can see, the more people of color within schools, the higher the poverty rates within the school. [Though the correlation coefficient is low for black students, there is clear evidence showing
a linear trend]. Starting with White students, there is already a very clear trend, where the more white students a school has, the school will more likely have lower levels of poverty. The correlation coefficient calculated using scipy.stats also justfies the behavior with a shocking -.7. Onto Black students,
thought the correlation coefficient is small, it is still a positive coefficient with a regression line showing another clear trend, opposite of white students. A huge issue arrises with Asian students which is discussed below. For hispanic students, with a higher correlation coefficient
and sadly better clarity, shows another positive trend between the number of hispanic students in schools vs poverty levels.
One interesting detail that was displayed that wasn't part of my hypothesis was that the graph between Asians vs % Poverty levels show almost no correlation. Though the linear
regression line shows a negative correlation, if you look at all the points, it seems a bit random. This led be to further look into the data I collected which pointed me into a signicant
that shouldn't be ignored, which is the fact that Asians is a misidentified group of minorities. Almost all minorities from different parts of Asia are just simply classified as "Asian".
This is a huge issue because that means indivduals of Chinese, Indian, Korean, Japanese, Vietnamese, Indonesian, Malyasian etc. are all classified into one category. This can be very misleading
because there can be signicant outliers for Asians, having one racial group have a poverty % than others or vise versa, presenting a huge problem for the Asian community.
The second half of the data, shows a time series of graduation rates from 2005 to 2014 for different racial groups.
Thankfully, there seems to be a general increase in graduation rates in NYC for all students, regardless of background. However, there still seems to be a huge disparty
between minority groups. As for Asians, I noted above that the data for Asians tend to be flawed because its a general census for the entire Asian community, so we cannot really explain
the trend. However for black and hispanic students, though the graph shows an increase in graduation rate throughout the years, the graduation rate is still sitting below a 70% average graduation rate, while compared to
white students, who are sitting at an average 75-80%. Whether it be funding, after-school programs, teaching stragdies, there is a clear racial disparity problem going on in NYC schools.
Solutions I advice:
From the data collected, there is clear evidence that there is a trend, and as stated before, it is not necessaril cause and effect , but there is a relationship present between racial backgrounds and education.
My solution for the NYC department of education is to first take the term "Asian" and breaking it up into multiple sub categories, because classifying everyone of Asian descent can be misleading and
can result in numerous errors and downfalls for students in need. My second solution is to look into the root of problem. Since there is a clear issue at hand, the best idea is to tackle whats causing the divide between minorites/lower economic familes and
white/higher economic status students. Do schools with more white students have better programs or are schools with higher number of minorites not getting enough funding?